


We present version 1.2.0 of the MoonGuard Filament Plugin! With this new update, we have added functionality to monitor the performance and health of your applications in production.
This functionality allows tracking of key indicators such as CPU load, RAM usage, and hard disk storage space.
This monitoring feature is crucial to ensure the efficiency and stability of your applications in production, allowing you to identify potential bottlenecks in performance and take corrective measures before they affect your users.
The reporting of these hardware variables is done through Larvis in your Laravel projects, so this new version of MoonGuard also implies a new release in Larvis.
For more details about Larvis, visit the documentation on Github.
To learn how to monitor hardware variables in PHP, visit the link.
New server_metrics table
In this version of MoonGuard, indicator data is stored in a new table called server_metrics. For users who are using older versions of MoonGuard, it is necessary to manually add this table in a migration file in your Laravel MoonGuard project. You can create a new migration called create_server_metrics_table and add the following code:
  Schema::create('server_metrics', function (Blueprint $table) {
    $table->id();
    $table->integer('cpu_load');
    $table->integer('memory_usage');
    $table->json('disk_usage');
    $table->foreignIdFor(SiteRepository::resolveModelClass())
        ->constrained()
        ->cascadeOnDelete()
        ->cascadeOnUpdate();

    $table->timestamps();
});
We have also updated the MoonGuard migration stub file to account for cases where the tables already exist in the database.
Sending Server Data from your Laravel App with Larvis
As we previously mentioned, Larvis will be responsible for sending server information to MoonGuard. We have added a new command in Larvis that you will need to schedule from your Laravel application. You can set the frequency to your preference, but we recommend a frequency of 5 minutes.
It would suffice to schedule the following command in your Laravel application (app/Console/Kernel.php):
class Kernel extends ConsoleKernel
{
    protected function schedule(Schedule $schedule)
    {
        $schedule->command(CheckHardwareHealthCommand::class)->everyFiveMinutes();
    }
}
For more details on how to use this command, refer to the Larvis documentation.
New columns to the sites table
We want MoonGuard to notify its users when the resources of their applications exceed the usage/consumption limits (in memory, CPU load, or disk space), we have updated the sites table to save the percentage value of these limits:
If you are currently using MoonGuard, you can add a new migration file (update_moonguard_sites_table) with the following columns:
Schema::table('sites', function (Blueprint $table) {
    $table->boolean('server_monitoring_notification_enabled')->default(false);
    $table->integer('cpu_limit')->nullable();
    $table->integer('ram_limit')->nullable();
    $table->integer('disk_limit')->nullable();
});
In the administration of your sites in MoonGuard, you will find the configuration for Server Monitoring and its limits. You can also enable or disable notifications.

The configuration of MoonGuard has been updated
In this update, we have added a new parameter and updated others:
'prune_exception' => [
    /*
     * Enable or disable pruning exceptions data.
     */
    'enabled' => true,

    /*
     * Eliminates exceptions that are older than 7 days.
     */
    'prune_exceptions_older_than_days' => 7,
],
'prune_server_monitoring' => [
    /*
     * Enables or disables pruning server monitoring data.
     */
    'enabled' => true,

    /*
     * Deletes server monitoring logs that are older than 7 days..
     */
    'prune_server_monitoring_records_older_than_days' => 7,
],
//...
'events' => [
    /*
     * The events that can be listened for.
     * You can add your own listeners here.
     */
    'listen' => [
    //...
        \Taecontrol\MoonGuard\Events\ServerMetricAlertEvent::class => [
        \Taecontrol\MoonGuard\Listeners\ServerMetricAlertListener::class,
        ],
    ],
],
In summary:
- We updated the name of the
exception_deletitionproperty toprune_exception. - A new parameter
prune_server_monitoringwas added, in which they can enable or disable the cleaning of records from theserver_metricstable (for those records that are older than 7 days) - A new event
ServerMetricAlertEventand a listenerServerMetricAlertListenerwere added.
You can find the complete configuration file in our documentation.
Resource Metrics on the Dashboard
On the dashboard, each site has a "site-stats" to view the status of the applications. These new metrics of CPU Load, Memory Usage, and Total Disk Used will also be available on these cards:

These cards provide a clear and concise view of the site's status, allowing quick identification of any potential issues. Additionally, by selecting a specific indicator, access to a more detailed view of that metric can be obtained.
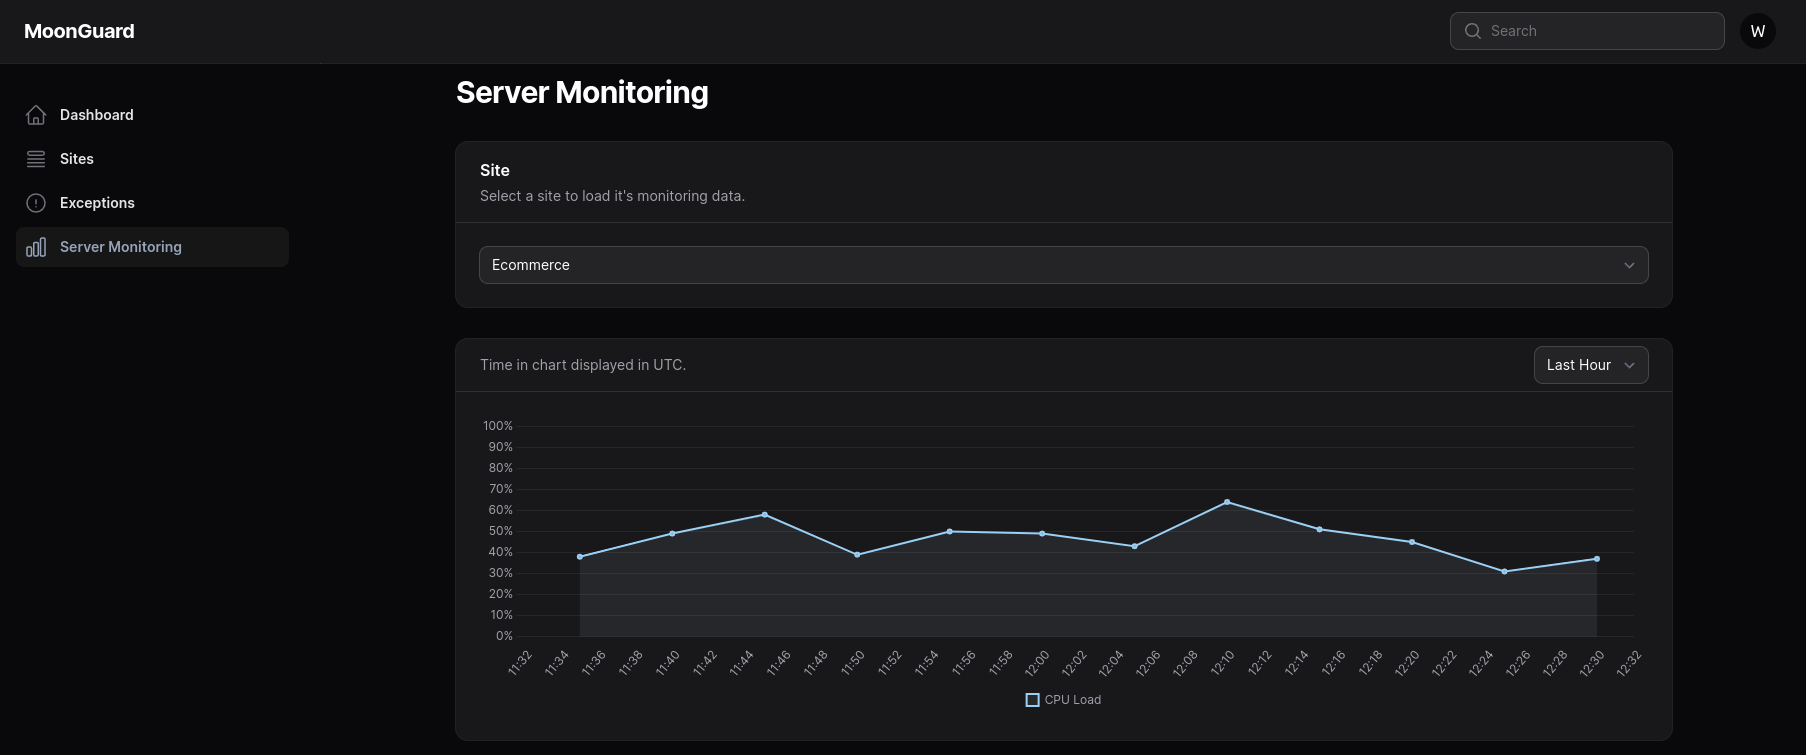
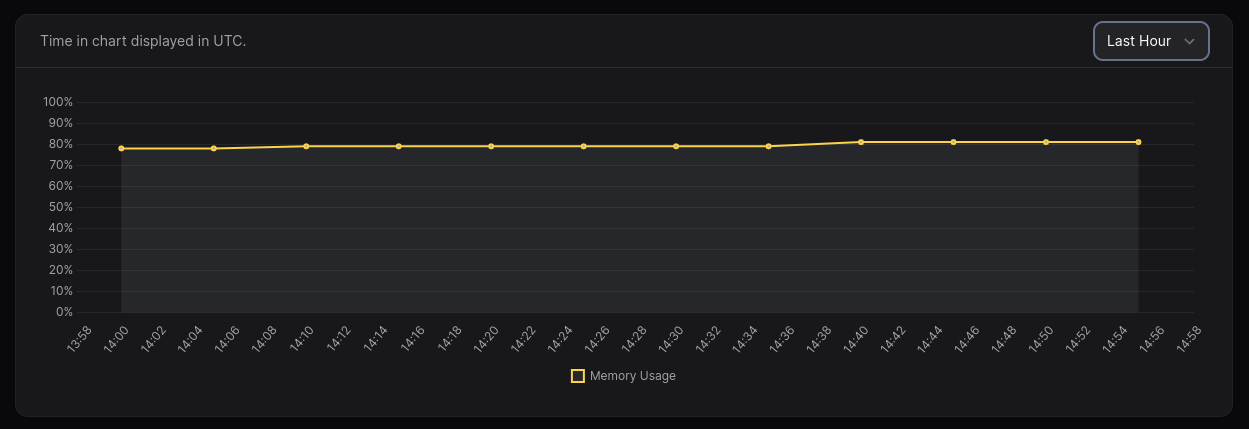
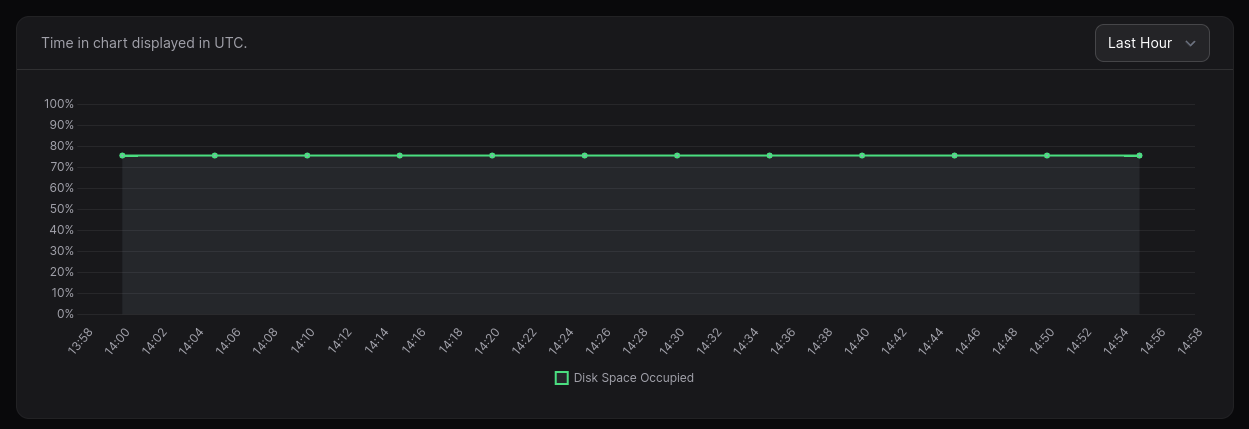
New Server Monitoring View
In the new Server Monitoring view, you can visualize each of the sites that have metrics via different line graphs. Each graph has a filter that allows you to select a monitoring period (hour, day, and week).
CPU Load:
Memory Usage:
Disk Space Occupied:
Adding command to delete old metrics
We created the PruneServerMetricCommand, where all metric records that are older than the time specified in the MoonGuard configuration are periodically deleted:
class Kernel extends ConsoleKernel
{
    protected function schedule(Schedule $schedule)
    {
        $schedule->command(PruneServerMetricCommand::class)->daily();
    }

    //...
}
This command works similarly to other MoonGuard commands (CheckUptimeCommand, CheckSslCertificateCommand, and PruneExceptionCommand). You can schedule the execution of this command or use the MoonGuardCommandsScheduler if you want to schedule these four commands:
protected function schedule(Schedule $schedule): void
{
    MoonGuardCommandsScheduler::scheduleMoonGuardCommands(
        $schedule,
        '* * * * *', // <-- Uptime Check Cron
        '* * * * *', //<-- SSL Certificate Check Cron
        '0 0 * * *', //<-- [Optional] Prune Exceptions Cron
        '0 0 * * *' //<-- [Optional] Prune Server Metrics
    );
}
For more information on how to use this command, refer to the Larvis documentation.
PruneExceptionCommand
We have refactored the name of the DeleteOldExceptionCommand command to PruneExceptionCommand for greater clarity and readability of its function. In addition to standardizing its name with PruneServerMericCommand. Both commands fulfill the function of deleting records from the database that are old according to the configuration parameters. You can register it in the console kernel like this:
class Kernel extends ConsoleKernel
{
    protected function schedule(Schedule $schedule)
    {
        $schedule->command(PruneExceptionCommand::class)->weekly();
    }

    //...
}
or using the MoonGuard Command Scheduler utility:
protected function schedule(Schedule $schedule): void
{
    MoonGuardCommandsScheduler::scheduleMoonGuardCommands(
      $schedule,
      '* * * * *', // <-- Uptime Check Cron
      '* * * * *', //<-- SSL Certificate Check Cron
      '0 0 * * *', //<-- [Optional] Prune Exceptions Cron
      '0 0 * * *' //<-- [Optional] Prune Server Metrics
    );
}
Thank you for reaching here and reading our article about the release 1.2.0 of MoonGuard!
If you want to learn more about the MoonGuard Filament Plugin, we invite you to read our book MoonGuard: The Software Creator's Journey V2 , where we discuss in detail how we created each of MoonGuard's functionalities as a plugin for Filament v3.
To learn more about MoonGuard, you can visit the website, follow us on Twitter/X , and join our discord community for more information.